


In This Article
Most social media reports are just expensive paperweights designed to make agencies look busy while your revenue stays flat. It’s a brutal truth. You’re likely drowning in meaningless data and fluff reports that fail to explain why a like matters for your bottom line. If you’re searching for a monthly social media report example that finally links your posts to actual sales, you’ve come to the right place. With 5.17 billion users active globally in 2026, there’s way too much noise to waste time on metrics that don’t pay the bills.
We know the pain of spending hours every month manually pulling numbers into a document nobody reads. It’s a soul-crushing waste of your talent. We promise to show you how to build a report that cuts through the nonsense and proves real ROI. You’ll learn to ditch the vanity metrics and focus on what actually moves the needle for your business growth.
We’re breaking down a clear, concise reporting framework that prioritizes value metrics over ego-stroking numbers. You’ll also discover how to turn raw data into a winning content strategy for the following month. Let’s stop guessing and start getting results.
Key Takeaways
- Stop wasting time on fluff and learn to treat your report as a strategic pulse check that actually justifies your marketing spend.
- See exactly how to structure a monthly social media report example so it tells a logical story from high-level ROI down to platform-specific wins.
- Learn why you should never report the same metrics for LinkedIn and TikTok, and how to track what actually matters for different parts of your funnel.
- Master the “So What?” test to turn raw data into a concrete content strategy that keeps your business moving forward.
- Discover why automated reporting tools usually miss the mark and how to add the human insight that links social engagement to real sales.
What is a Monthly Social Media Report? (The Non-Boring Version)
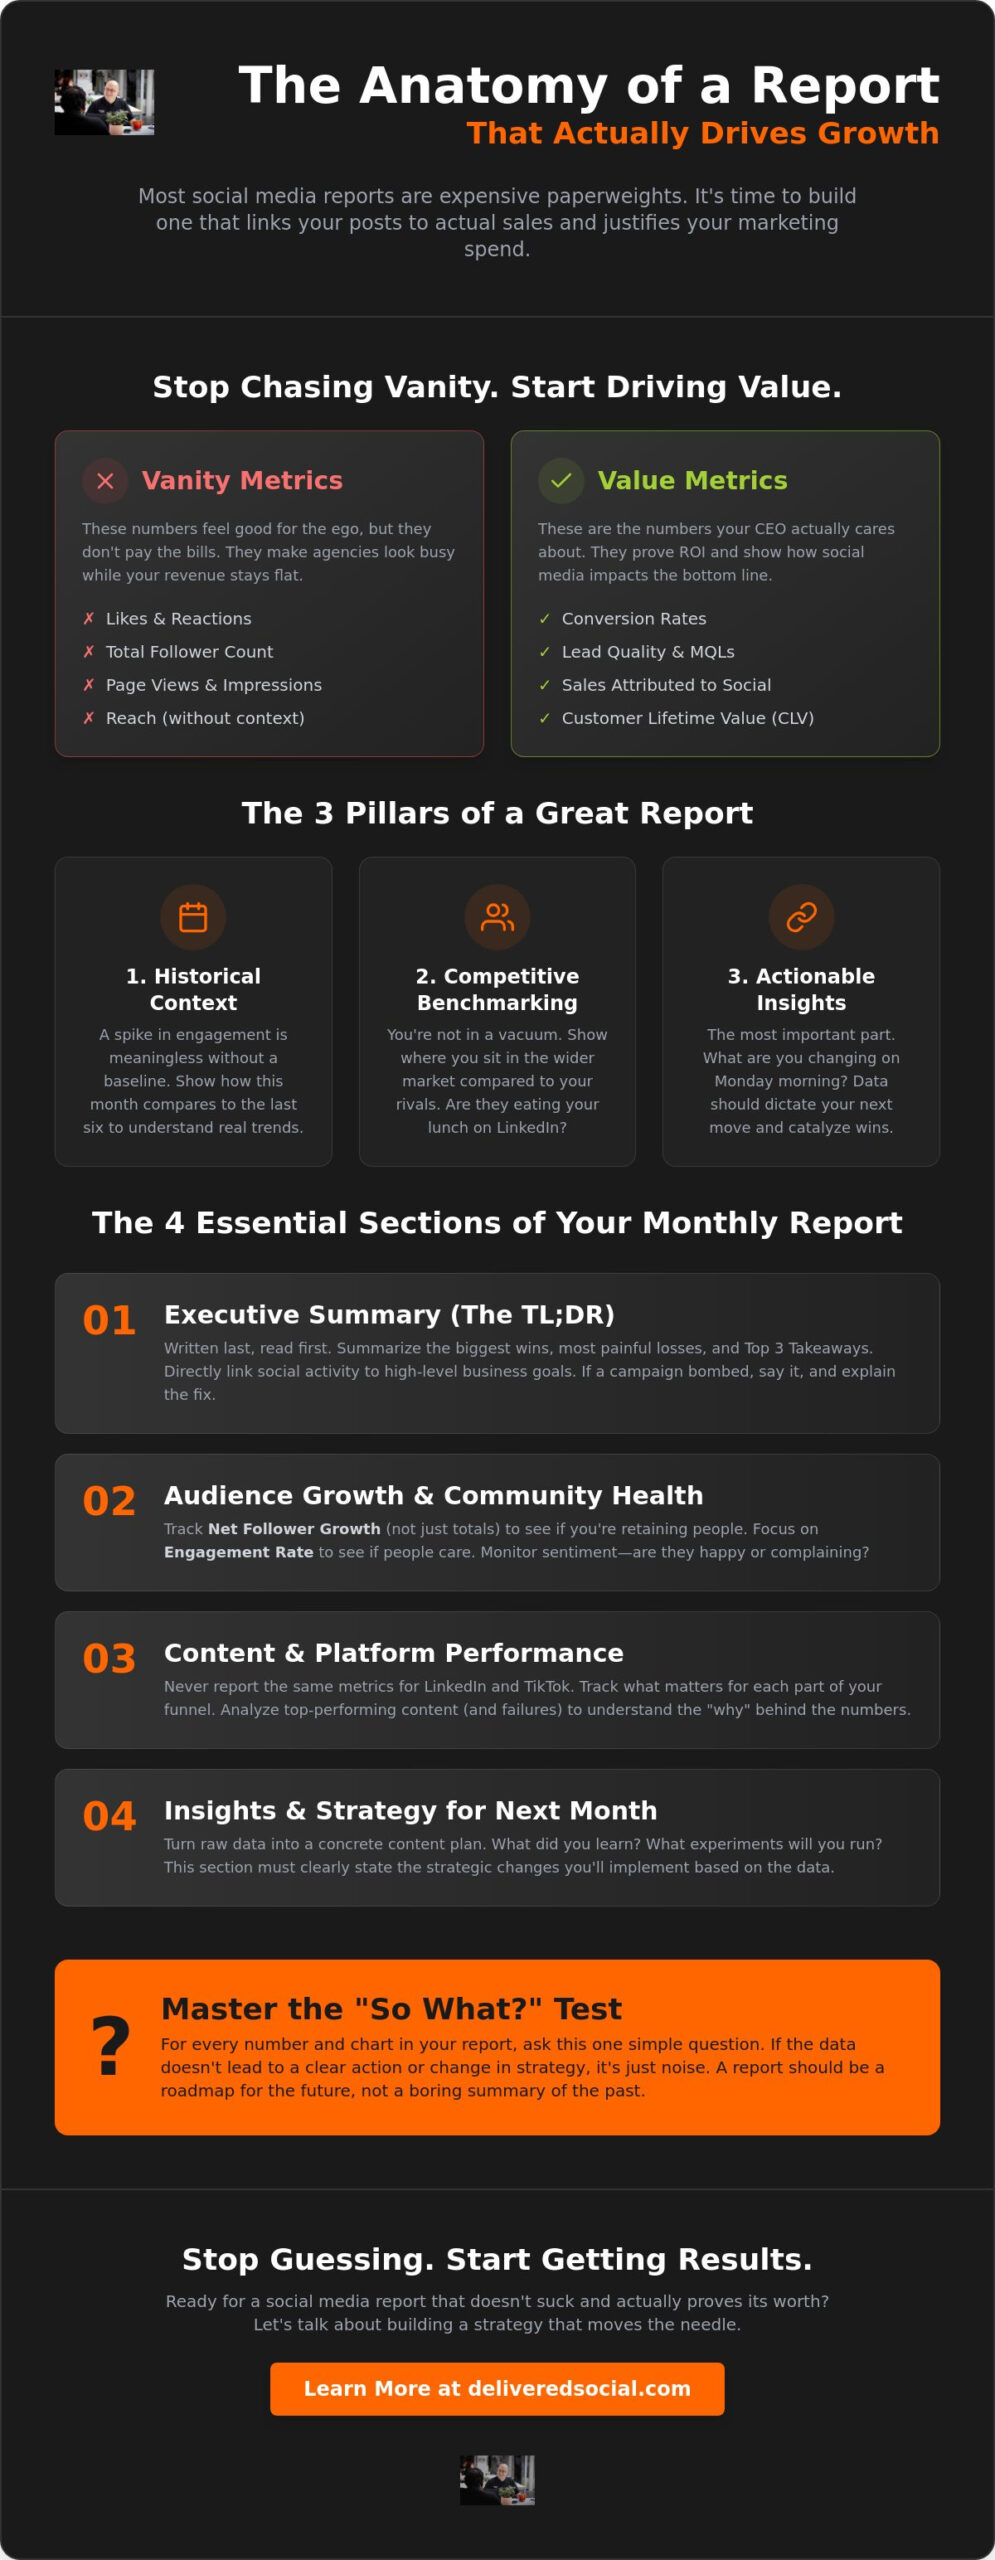
A monthly social media report is your business’s pulse check for the digital world. It is not just a collection of screenshots or a dump of every notification you received over the last thirty days. If your report looks like a digital scrapbook, you are doing it wrong. A real report is a strategic document. It justifies your marketing spend. It explains why your content matters. Understanding what social media measurement is helps you separate the noise from the signal. The goal is simple. Show what worked, what failed, and what you are doing about it. If your report does not lead to a change in strategy, it is just a waste of paper. Stop treating data like a chore. Treat it like a roadmap for your business growth.
Vanity Metrics vs. Value Metrics
Likes are the ultimate vanity metric for most businesses. They feel great for the ego, but they do not pay the bills. Unless your landlord accepts “hearts” as rent, stop obsessing over them. The metrics that actually matter are conversion rates and lead quality. These are the value metrics. Your CEO does not care about your follower count if those followers never buy anything. When you examine a monthly social media report example, look for the data that proves ROI. Focus on the numbers that keep the lights on. You need to identify which numbers your leadership actually cares about. Usually, that is growth, leads, and sales. Everything else is just fluff designed to make an agency look busy while your revenue stays flat.
The Three Pillars of a Great Report
A solid report stands on three pillars. First, historical context. You need to know how this month compares to the last six. A spike in engagement is meaningless without a baseline. If you grew 5% but your average is 10%, you are actually losing ground. Second, competitive benchmarking. You are not operating in a vacuum. You need to know where you sit in the wider market compared to your rivals. Are they eating your lunch on LinkedIn? You need to know. Finally, actionable insights. This is the most important part of any monthly social media report example. What are we changing on Monday morning? If the data does not dictate your next move, you are just staring at numbers for fun. A report should be the catalyst for your next big win, not a boring summary of the past.
We see too many businesses drowning in meaningless data. They spend hours every month building reports manually that nobody actually reads. It is a soul-crushing waste of talent. Your reporting should cut through the noise. It should prove your value. Most importantly, it should help your business grow. If it is not doing those three things, it is time to throw your current template in the bin and start fresh.
The 4 Essential Sections of a Real Monthly Social Media Report Example
Every solid report needs a logical flow. It should tell a story from start to finish. You aren’t just throwing numbers at a wall to see what sticks. You are building a case for your strategy. Start with the big picture. Zoom into the granular details later. Make the whole thing scannable. Nobody has time for a 50-page PDF. Use visualisations that make trends obvious at a single glance. If someone has to squint to understand your chart, you’ve failed. A perfect monthly social media report example balances the “what” with the “why” to provide a unified look at your organic and paid efforts.
The Executive Summary (The TL;DR)
Think of this as the TL;DR. Always write this part last. It summarises the biggest wins and the most painful losses from the past month. Include your “Top 3 Takeaways” right at the top for stakeholders who are short on time. They want to know if the ship is sailing or sinking. Link your social activity directly to high-level business goals. If a monthly social media report example doesn’t show how social impacts the bottom line, it’s just a hobby. Be blunt about what happened. If a campaign bombed, say it. Then explain how you’ll fix it.
Audience Growth and Community Health
Track “Net Follower Growth” instead of just total numbers. You need to see if you are actually retaining people or if they are hitting the unfollow button. Total engagement is a vanity number. Engagement rate is where the truth lives. It tells you if people actually care about what you’re saying. Don’t ignore sentiment analysis. Are people happy with your brand? Or are they just tagging you to complain? Knowing the vibe of your community is vital for long-term health. If this feels like a lot to track, our Social Media Management team can take the heavy lifting off your plate.
Conversion and ROI Tracking
This is the “Money Section.” It covers click-through rates and direct conversions. Attribution is always a challenge. Social is often the “assist” that leads to a sale later. It is like the midfielder who sets up the striker. You need to account for that multi-touch journey. If you are running paid campaigns, track your Cost Per Lead (CPL) religiously. This data is the foundation of turning data into a growth strategy. Without this section, you’re just guessing. You need to prove that every pound spent is working hard for the business.
Platform-Specific Reporting Examples: What to Track Where
You can’t just copy-paste your LinkedIn metrics into your TikTok report. That’s lazy. It’s also completely useless. Each platform serves a unique purpose in your marketing funnel. Some are for building a vibe. Others are for closing deals. Focus on the primary action for each channel. Avoid the “data dump” at all costs. Only report what actually matters for that specific platform’s goal. If you are looking for a monthly social media report example that works, it needs to recognize these differences. Stop treating every feed like the same room.
Instagram and Facebook: The Community Builders
Meta platforms are where your brand lives and breathes. With 3.56 billion daily active people across their apps as of early 2026, the reach is massive. Track reach and impressions to see who is noticing you. But don’t stop there. Story engagement is a massive indicator of brand loyalty. These are your super-fans. Saves and shares are the ultimate proof of value. If people save your post, they want to come back to it. That’s a win. Instagram is used by 70% of marketers for a reason. It builds a community that actually likes you.
LinkedIn: The Authority and Lead Machine
LinkedIn has entered its creative era. It’s not just for boring resumes anymore. It’s a lead machine. Track employee advocacy. How much reach is your team generating? It is often more authentic than the brand page. Monitor your Lead Gen Forms. Look at completion rates and the cost per qualified lead. Analyze your content types. Are your expert-level, original posts actually building authority? If not, pivot. In 2026, LinkedIn’s algorithm favors expert-level content. If you aren’t showing off your brains, you’re invisible.
TikTok and Video: The Reach Accelerators
Short-form video is the king of engagement. Algorithms now prioritize watch time and completion rates over follower counts. This is a huge shift. If people aren’t watching to the end, the algorithm will bury you. Track your retention rate religiously. Where are people dropping off? Use this data to sharpen your hooks. Did you jump on a viral sound or trend? Report on whether that actually drove new eyes to the brand. With 5.17 billion social media users worldwide, video is your fastest ticket to being seen. A great monthly social media report example must highlight these video-first metrics.
Stop reporting for the sake of reporting. Start reporting for the sake of winning. If you need help producing the high-quality content these platforms demand, our Video Production team can help you dominate the feed. We don’t do boring. We do results.
The “So What?” Test: Turning Data into a Growth Strategy
Every data point in your report should be followed by a “So what?”. If you can’t explain why a number matters, it shouldn’t be in the report. Analysis is about finding the “Why” behind the “What”. A monthly social media report example is worthless if it doesn’t change your behavior. You aren’t just a data entry clerk. You are a strategist. Use your monthly report to kill off content types that aren’t performing. If a specific post format is consistently tanking, stop doing it. It really is that simple. Your time is too valuable to waste on content that your audience ignores.
Step 1: Identifying Trends, Not Just Blips
Don’t panic because you had one bad Tuesday. You need to spot a seasonal trend versus a genuine strategy failure. Over-reacting to one bad week of performance is a rookie mistake. It leads to knee-jerk reactions that ruin long-term growth. Three months of data is the minimum for a real trend analysis. If your reach is down in December because your audience is busy with holidays, that’s seasonal. If it’s still down in March, you have a fundamental problem with your creative. Look for patterns over time to see the truth.
Step 2: Adjusting the Content Calendar
Double down on the winners. If your short-form videos are crushing it, stop making text-heavy carousels. Repurpose your top-performing posts into new formats. This is a “Content Audit” in action. Identify themes that consistently underperform and cut them loose. Test new hypotheses based on last month’s data. This keeps your strategy fresh and results-oriented. If a post about your team gets 10x the engagement of a product shot, give the people what they want. Your data is literally telling you how to win. Listen to it.
Step 3: Presenting to Stakeholders Without the Jargon
Stop using acronyms that make people’s eyes glaze over. Translate “CPC” and “CTR” into “Business Growth” and “Leads”. Your boss wants to know if the money they spent is coming back. Use SEO services Surrey to show the bigger digital picture. Social doesn’t live in a vacuum. It works alongside your search presence and web traffic. Since 72.3% of internet users aged 16 and over use social media to research products, you must prove you are winning that research phase. When handling “Bad News”, be honest. Show the data, explain why it happened, and present the fix. That’s how you look like a pro.
Ready to stop guessing and start growing? Our Social Media Management team can turn your messy data into a clear roadmap for success. We do the analysis so you can focus on running your business.
Get a Social Media Report That Doesn’t Suck
Reporting is hard work. Managing the actual social media accounts is even harder. You’re trying to run a business, not play with data points all day. Most people settle for automated templates that look pretty but say absolutely nothing. These tools usually miss the nuance of your specific business. They can’t tell you why a specific comment led to a high-value lead. If you’ve been looking at a monthly social media report example and feeling underwhelmed, it’s because you’re missing the human insight. You need a report that actually tells you the truth, even when it’s blunt.
The Delivered Social Approach
We don’t just send over a cold PDF and hope for the best. We have real conversations about your growth. Our philosophy is simple. No fluff. Just results you can actually see in your bank account. By integrating your social presence with a wider digital marketing agency Surrey strategy, we make sure every post has a purpose. We provide transparent, blunt reporting. You’ll always know exactly where you stand. No hiding behind big numbers that don’t mean anything. We’re your partners in this, not just another line item on your expenses.
Stop Wasting Time on Spreadsheets
You should be focused on running your business. Let us handle the soul-crushing data crunching. We take the reporting burden off your plate so you can breathe again. You’ll get consistent, monthly updates that keep you in the loop without the headache. In 2025, sales through social platforms accounted for 17% of all online sales. You can’t afford to get this wrong by staring at a spreadsheet you don’t understand. If you are ready to see what a real monthly social media report example looks like, let’s talk. We’ll show you the difference between a list of numbers and a strategy for winning.
Next Steps for Your Social Strategy
Social is just one piece of the puzzle. If you want faster results, check out our guide to PPC services. It’s the no-nonsense way to dominate paid search and get your brand in front of the right people. You can also book a Social Media Clinic with us. We’ll audit your current reporting and tell you exactly what’s broken. Join the community of local businesses that are growing with Delivered Social. We’re here to help you win, not just to fill up your inbox with fluff reports that nobody reads.
Start Making Your Data Work as Hard as You Do
You’ve seen what a real monthly social media report example looks like. It isn’t a graveyard of screenshots. It’s a living strategy. Stop letting vanity metrics like follower counts distract you from the numbers that actually pay the bills. If you can’t pass the “So What?” test, your data is just noise. You need to treat every platform with the respect it deserves by tracking the specific actions that drive your funnel forward. Data is only useful if it dictates your next move.
We’ve spent over 8 years cutting through the nonsense of digital marketing. Our expert team doesn’t hide behind industry jargon or fluff. We provide results-driven reporting that focuses entirely on your ROI. You deserve a partner who cares about your bottom line as much as you do. We’re here to help you turn those confusing spreadsheets into a clear roadmap for success. It’s time to stop guessing and start winning.
Tired of fluff? Get a social media report that actually works. Let’s have a real conversation about your growth and get your social strategy back on track. You’ve got the tools. Now it’s time to use them.
Frequently Asked Questions
How long should a monthly social media report be?
A monthly report should be as short as possible while still being useful. Usually, this means five to ten pages at most. If you hit fifty pages, you’ve likely lost your audience already. Focus on high-impact visualisations and clear takeaways. Your goal is to provide a scannable document that highlights wins and losses without burying the lead in a mountain of digital clutter.
What is the most important metric in a social media report?
The most important metric is always the one that matches your specific business goal. For most, this means conversion rate or lead quality. While reach and impressions tell you if people are looking, conversions tell you if they are buying. If you are following a solid monthly social media report example, you’ll see that the “money metrics” always take priority over vanity numbers like likes or follows.
Can I automate my monthly social media reporting?
You can automate the data collection, but you can’t automate the strategy. Tools like Looker Studio are great for pulling numbers into one place without the manual headache. However, a machine can’t tell you “why” a post failed or how to pivot next month. Use automation to save time on the boring stuff so you can spend more time on the actual human analysis that grows your business.
How do I show social media ROI in a report?
Show ROI by using tracking pixels and UTM codes to link social clicks to actual revenue. You need to prove that a user who started on Instagram ended up on your checkout page. Direct sales are the gold standard, but don’t ignore the “assist” value of social. Even if they don’t buy immediately, tracking their journey through your funnel proves that your social spend is actually working for the bottom line.
What tools should I use to create a social media report example?
Use native platform insights or a unified dashboard to build your report. Native tools on Meta or LinkedIn are great for deep dives into specific post performance. For a more professional monthly social media report example, many businesses use third-party dashboards to pull everything into a single, clean view. Just make sure the tool you choose focuses on clarity rather than just making complex, confusing charts.
What happens if my social media metrics go down one month?
Don’t panic if your metrics dip for a single month. Social media is rarely a straight line up. Instead, look for the reason behind the drop. Was it a seasonal holiday? Did the algorithm change? Or did you just post boring content? Use a dip as a learning opportunity to refine your strategy. One bad month isn’t a failure; it’s just data telling you to try something new.
Should I include competitor data in my monthly report?
You should definitely include competitor data to provide context for your own performance. Knowing that your engagement is up is good. Knowing that your main rival’s engagement is down while yours is up is even better. Use competitive benchmarking to see where you sit in the wider market. It helps you spot gaps in their strategy that your brand can swoop in and fill immediately.
How do I present a social media report to a client or boss?
Present your report by leading with the wins and skipping the technical jargon. Your boss wants to know three things: what happened, why it matters, and what happens next. Start with the executive summary. Speak in plain English. If you can’t explain a metric in one simple sentence, it probably shouldn’t be in your presentation. Keep it fast-paced, honest, and focused on the future.