


In This Article
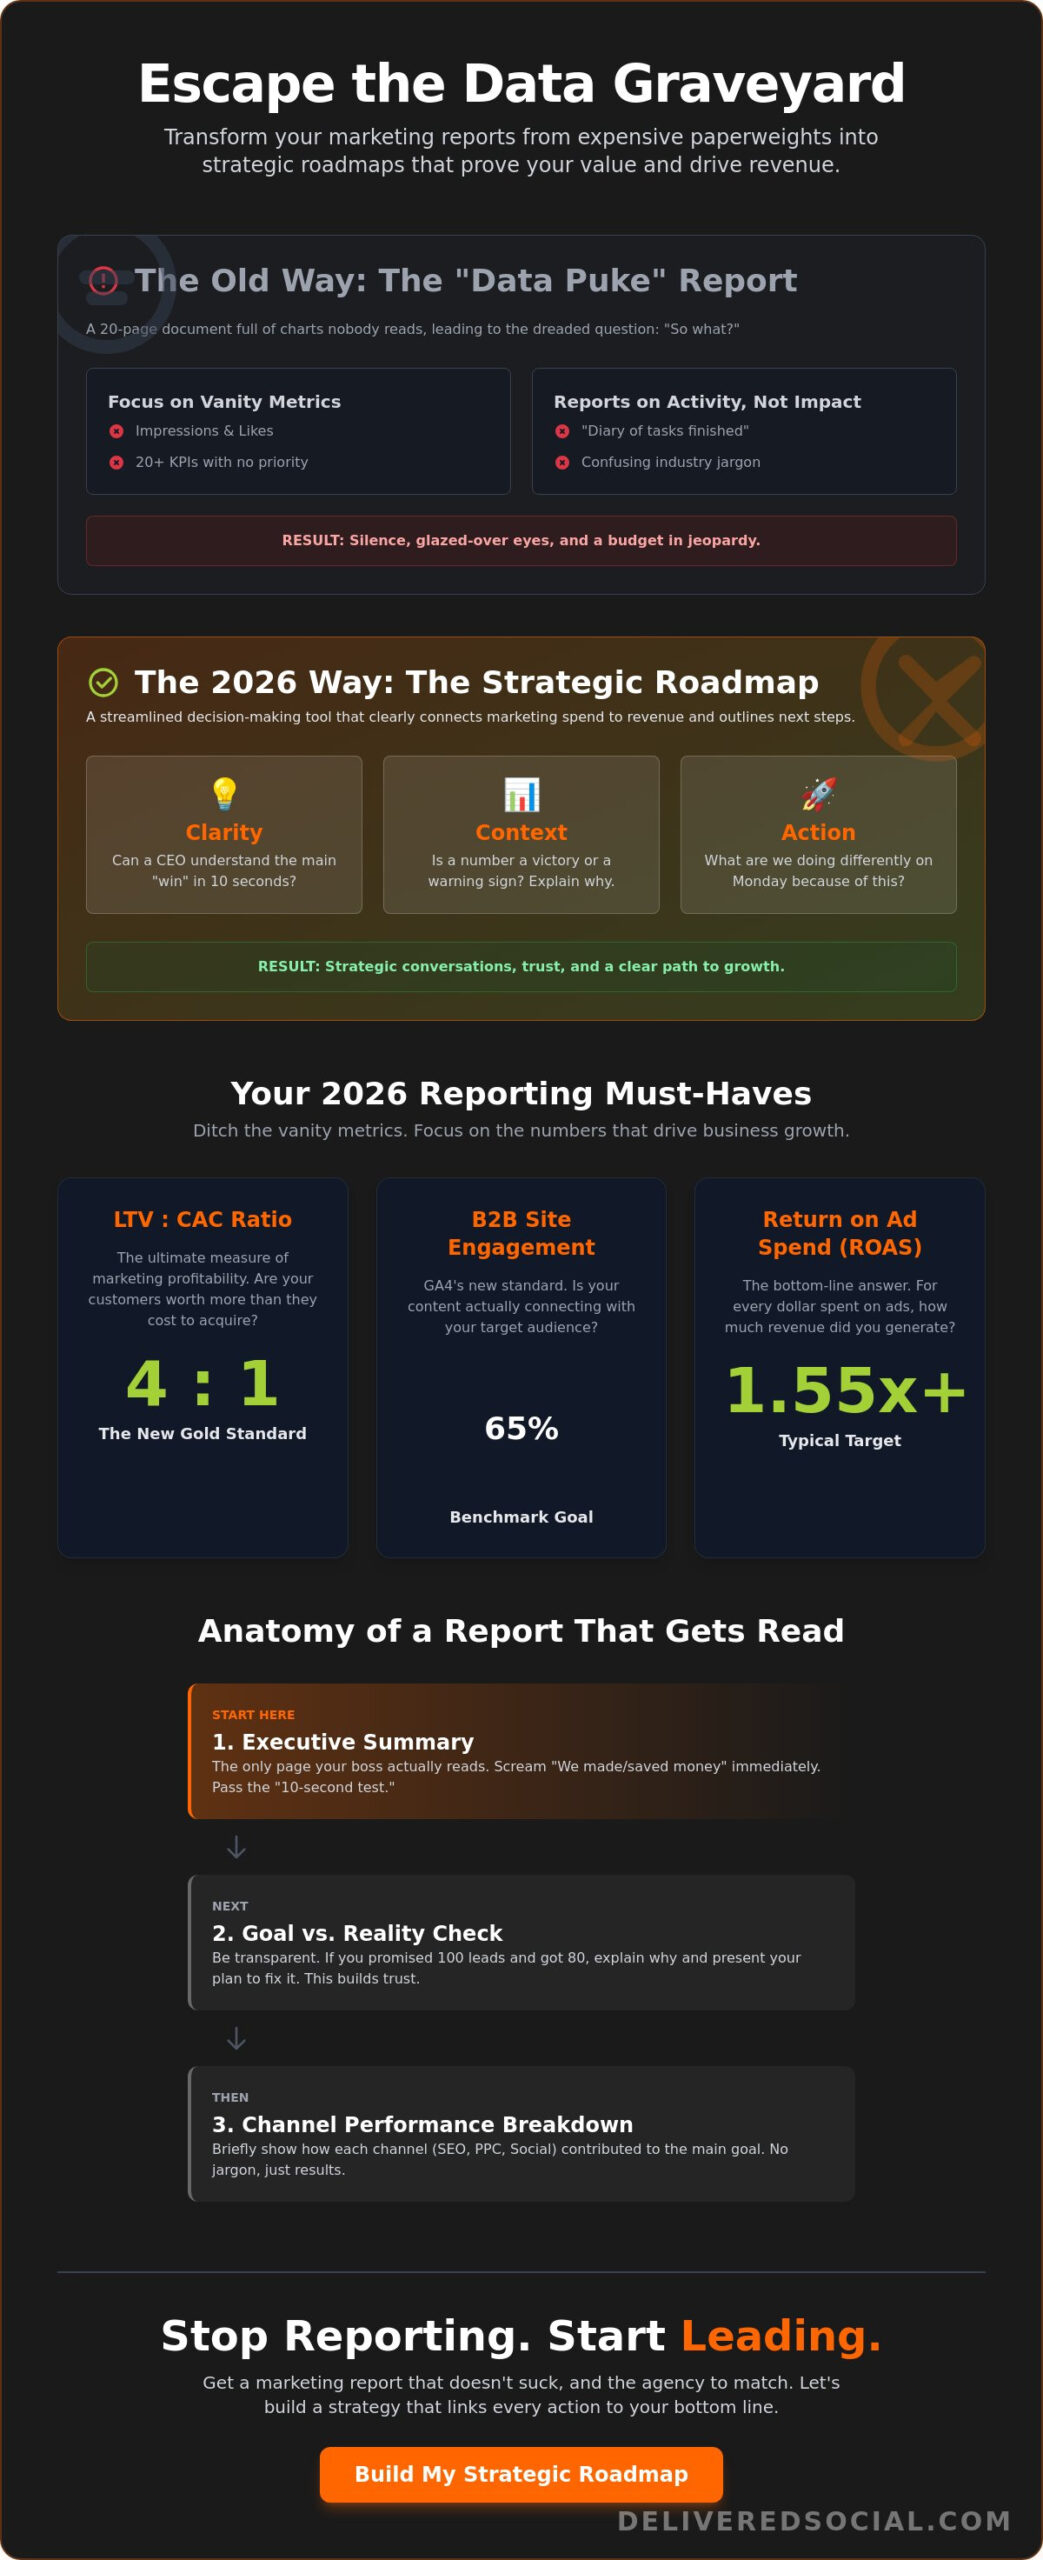
Most marketing reports are just expensive paperweights. You spend six hours every month pulling numbers from five different platforms, only to hand over a 20-page deck that makes your client’s eyes glaze over. It’s “data puke” at its finest. You know it, and your stakeholders definitely know it when they ask “so what?” after every slide. If you’re tired of reports that look busy but say nothing, you need a marketing performance report template that actually connects your hard work to the bottom line.
We’ve all been there, staring at a screen and hoping the numbers look impressive enough to justify next month’s budget. But in 2026, with Google’s June 15th consent update and the latest GA4 attribution models, “looking busy” doesn’t cut it anymore. This guide will show you how to ditch the fluff and focus on the metrics that drive actual business growth. We’ll look at why a 4:1 LTV:CAC ratio is your new best friend and how to hit that 65% engagement rate benchmark for B2B sites. By the end, you’ll have a streamlined reporting process that turns messy data into a clear roadmap for revenue.
Key Takeaways
- Learn how to escape the “data puke” trap by building a report that functions as a strategic decision-making tool rather than a boring history lesson.
- Discover how to tailor your marketing performance report template for different audiences, ensuring CEOs get the big picture while managers get the tactical data they need.
- Master the “So What?” test to audit every chart in your deck and ensure each data point is actively driving business growth.
- Find out how to write human-centric insights that clearly link your marketing spend to revenue without relying on confusing industry jargon.
- Get a clear roadmap for reporting in 2026 that balances new privacy regulations with the need for transparent, results-driven metrics.
What is a Marketing Performance Report (And Why Most Suck)?
Let’s be blunt. Most marketing reports are basically just expensive napkins. You spend hours every month dragging data from five different platforms into a slide deck that nobody actually reads. It’s frustrating. It’s a waste of time. And frankly, it’s why so many business owners think marketing is just a black hole for cash. You don’t need more data; you need better answers.
A real marketing performance report is a strategic document. It measures Marketing effectiveness by showing exactly how your digital efforts move the needle. It isn’t just about “stuff that happened” last month. It’s about “stuff that matters” for next month. You might find a fancy marketing performance report template online, but remember: the template is just the skeleton. You need the muscle of a real strategy to make that skeleton walk and talk. Without it, you’re just looking at a digital graveyard of clicks and impressions.
The “Data Puke” trap is a common trap for agencies. They think more charts equal more value. Wrong. If you send a 50-page PDF full of screenshots, you aren’t reporting. You’re hiding. You’re hoping the sheer volume of numbers will stop anyone from asking hard questions about the budget. A great marketing performance report template should cut through that noise and tell the truth, even if the truth is that a specific campaign flopped. Honesty builds trust; big numbers just build suspicion.
The 3 Pillars of a Useful Marketing Report
Stop complicating things. Your report needs three things to be worth the paper it’s printed on. First, it needs Clarity. If a busy CEO can’t understand the main “win” in ten seconds, you’ve failed. Second, it needs Context. Numbers don’t live in a vacuum. If your CPC went up, is that bad? Or did you just pivot to a higher-intent audience to maintain your 1.55x ROAS benchmark? You need to explain if a number is a victory or a warning sign. Third, it needs Action. Data is useless if it doesn’t change your behavior. Every report must answer: “What are we doing differently on Monday because of this data?”
Signs Your Current Reporting is Broken
Is your reporting actually working? Probably not if you recognize these red flags. If you’re tracking 20+ different KPIs but can’t name the top three that actually pay the bills, you’re lost. If your “Executive Summary” reads like a diary of tasks you finished rather than the revenue results you got, you’re reporting on activity, not impact. The biggest sign? Silence. If nobody asks questions or challenges your data after a presentation, it’s because they’ve already checked out. They don’t see the value, and honestly, can you blame them? It’s time to stop reporting and start leading.
The Anatomy of a Marketing Performance Report That Actually Gets Read
Most reports are built upside down. They start with the boring technical stuff and bury the results on page 15. Flip it. Your report should start with the Executive Summary. This is the only page your boss or client actually reads. It needs to scream “We made money” or “We saved money.” If you’re using a marketing performance report template, make sure this summary is right at the front. It’s the hook that proves you aren’t wasting their time.
Next, you need a Goal vs. Reality check. Be transparent. If you promised 100 leads and only got 80, say so. Explain why it happened and how you’re fixing it. This builds more trust than a 20-page deck of “everything is great” fluff. Then, dive into your specific channels. Whether it’s SEO, PPC, or Social, keep it brief. No jargon. Just show how these channels contributed to the primary goal. You need to measure marketing effectiveness by looking at the hard numbers, not just busy graphs.
Kill the Vanity Metrics
Impressions are a liar’s metric. Having a million people “see” your ad means nothing if nobody clicked. The same goes for social media likes. Likes don’t pay the bills. Clicks, conversions, and actual human engagement do. In 2026, the benchmark for website engagement in GA4 is 65% for B2B sites. If you aren’t hitting that, your content isn’t landing. Stop reporting on how many people looked at you and start focusing on your Conversion Rate and Cost Per Lead (CPL). Those are the numbers that keep the lights on.
Linking Marketing to the Bottom Line
This is where you prove your worth. You need to talk about Return on Ad Spend (ROAS). While the industry average is around 1.55x, e-commerce businesses usually need to hit 4x or higher to actually stay profitable. Don’t hide the math. Show your Customer Acquisition Cost (CAC) alongside your lifetime value. A healthy 4:1 LTV:CAC ratio is the gold standard for growth right now. Marketing spend correlates directly to sales growth when every dollar spent is tracked against the specific revenue it generated.
Finally, own your “Wins and Losses” section. If a campaign bombed, tell them what you learned. This makes the wins feel earned and real. End with a clear roadmap for the next 30 days. If you’re struggling to turn your data into a clear story, it might be time to chat with a team that actually enjoys the “so what” part of reporting. A good report isn’t a history lesson; it’s a strategy for what happens next Monday.
Choosing the Right Marketing Report Template for Your Audience
Stop treating every stakeholder like they have the same brain. They don’t. Your CEO doesn’t care about your bounce rate or the specific alt-text you added to a blog post. They care about growth. Conversely, your marketing manager needs to see the gritty details to know which levers to pull next Tuesday. A marketing performance report template shouldn’t be a one-size-fits-all document. It’s a flexible tool that you pivot based on who is sitting across the table.
The CEO report should be high-level and incredibly short. Think of it as a “money in vs. money out” summary. If it’s longer than two pages, you’ve already lost them. Focus on the big wins and the ROI. The Marketing Manager report, however, is where you get tactical. This is the place for granular data on conversion rates, ad spend, and channel-specific performance. This is especially true when reporting on PPC services where costs can spiral if you aren’t watching the right numbers. Finally, the Client report needs to be a bridge between the two. It should focus on transparency and trust, showing them exactly where their budget went and why they should keep giving it to you.
Static vs. Interactive: The Great Debate
You have to choose your weapon: the static PDF or the live dashboard. Static PDFs are brilliant for monthly archives. They freeze a moment in time, making it easy to look back and see exactly what happened in October. They’re also great for keeping people focused on the story you’re telling. Live dashboards, while flashy, can be a recipe for a headache. They often lead to “micromanagement” of data where clients panic over a 2% dip on a random Wednesday afternoon. Use live tools for your internal team, but stick to a curated marketing performance report template in PDF or PowerPoint for official meetings. Save the deep-dive decks for your quarterly business reviews.
Format Comparison Table
| Report Type | Ideal Length | Primary Focus | Best Use Case |
|---|---|---|---|
| Executive Summary | 1 Page | Revenue and ROI | CEO / Board Meetings |
| Performance Audit | 15+ Pages | Granular Channel Data | Internal Strategy / Long-term SEO |
| Tactical Update | 3-5 Pages | CPL and Conversions | Marketing Managers / PPC tracking |
Choosing the right format is half the battle. If you’re managing long-term branding, a monthly PDF that shows trend lines is perfect. If you’re running fast-paced digital ads, you might need a more frequent, punchy update. Just remember: the tool you use, whether it’s Canva, Excel, or Looker Studio, matters less than the clarity of the message. Pick the one that helps you tell the truth the fastest.
From Data to Action: How to Stop Reporting and Start Strategizing
Data is just noise until you give it a job. You can have the prettiest marketing performance report template in the world, but if it doesn’t lead to a decision, it’s a waste of pixels. Most people treat reporting like a history lesson. They look back at what happened and call it a day. That’s a mistake. A real report is a launchpad for what happens next. It’s about moving from “here is what we did” to “here is how we’re going to win next month.”
Every single chart in your deck must pass the “So What?” test. If you show a graph of rising traffic, ask yourself: So what? If the answer is just “it looks good,” it doesn’t belong in the meeting. If the answer is “this traffic is coming from high-intent keywords that are lowering our CPL,” now you’re talking strategy. Stop being a data collector and start being a strategist. Your stakeholders don’t want a spreadsheet. They want a plan.
How to Spot Trends Before They Become Problems
Context is everything. A 10% drop in traffic might look scary month-over-month (MoM), but what does it look like year-over-year (YoY)? If you’re using your SEO services report correctly, you can predict seasonal shifts before they hit. For instance, many industries see a dip in December, but if your 2026 numbers are higher than your 2025 numbers, you’re still on the right track. One bad week is a blip. Three bad weeks is a fire. Use your data to catch the smoke before the whole building goes up.
Communicating Results to Non-Marketers
Stop using acronyms. Your CEO doesn’t care about CTR, SERPs, or CPC. They care about business outcomes. When you talk to non-marketers, use analogies. Explain that SEO is like building a house you own, while PPC is like renting a flat; both have value, but they work differently. Focus on the money. Instead of saying “our engagement rate hit 71%,” say “our content is resonating with more potential buyers than last month.” This shifts the conversation from marketing outputs to actual business growth.
Every marketing performance report template needs a “Next Steps” section. This is the most important part of the entire document. It turns a “down” month into a strategic pivot rather than an excuse. If a campaign failed, own it, explain the lesson, and outline the fix. This transparency builds a level of trust that no “perfect” report ever could. If you want a reporting partner who focuses on the “so what” instead of just the “what,” come and have a chat with us. We’ll help you turn those numbers into a real roadmap.
Get a Marketing Report That Doesn’t Suck (and the Agency to Match)
At Delivered Social, we hate boring reports as much as you do. Maybe even more. We’ve seen too many agencies hide behind 40-page PDFs that are basically just “data puke” in a fancy wrapper. That’s not us. Our approach is refreshingly blunt: if it doesn’t help you make more money or save more time, we don’t report on it. We aren’t here to look busy; we’re here to get results. When you use our marketing performance report template, you aren’t just getting a document. You’re getting a clear, no-nonsense look at your business’s health.
We believe in total transparency. That means we own the wins, but we also own the losses. If a campaign didn’t land, we’ll tell you why and what we’re doing to fix it. We integrate your social media management with your overall business goals. It’s not just about likes; it’s about how those likes turn into leads. When you stop guessing and start measuring with us, you get a partner who treats your budget like it’s our own. No fluff. Just growth.
Beyond the Template: The Delivered Social Way
A template is a start, but it’s not the whole story. We don’t just email you a file and vanish. We have actual conversations about your growth. As a digital marketing agency that actually gives a toss, we focus on the metrics that move the needle. Our clients actually look forward to their monthly reviews. Why? Because we talk like humans, not robots. We explain what the numbers mean for your bank account, not just your analytics dashboard. It’s about building a partnership based on trust and tangible outcomes.
Ready to Cut the Fluff?
It’s time to stop drowning in spreadsheets. You’ve got a business to run. You don’t have six hours to spend deciphering why your “impressions” are up but your sales are down. Let us handle the heavy lifting. We’ll build a marketing performance report template that actually makes sense for your specific goals. We want to show you exactly how your marketing spend is working for you, without the headache of traditional agency jargon.
Ready to see what real reporting looks like? We’d love to show you how we’d report on your business specifically. No pressure. No boring sales pitches. Just a casual, high-energy chat about where you are and where you want to go. Reach out and book a time with the team today. Let’s get to work and start making those numbers mean something.
Stop Guessing and Start Growing
You’ve got better things to do than spend six hours a month shouting into the void of a twenty-page slide deck. Real reporting isn’t about how many charts you can jam into a PDF. It’s about clarity, context, and knowing exactly what you’re doing differently on Monday morning. By focusing on the “so what” and cutting out the vanity metrics, you turn your data into a real growth engine. Whether you’re building your own marketing performance report template or looking for a partner to do the heavy lifting, remember that transparency is your best friend.
We’re a results-driven digital agency that actually gives a toss about your bottom line. We don’t do fluff, and we definitely don’t do boring. Our no-nonsense approach to data means you get human-centric reporting that actually helps you make decisions. Ready for a marketing report that actually makes sense? Let’s chat! You’ve got the tools. Now, let’s go make some noise.
Frequently Asked Questions
What should be included in a basic marketing performance report template?
A basic marketing performance report template needs to cover the executive summary, goal tracking, and channel-specific results. Don’t forget a “Wins and Losses” section to keep things honest. Every slide should answer the “so what” question so your stakeholders don’t have to guess. It’s about showing how your marketing spend actually correlates to sales growth. Keep it lean and focus on the metrics that pay the bills.
How often should I send a marketing performance report?
You should send a full report once a month, but keep an eye on the data daily. Monthly reporting gives you enough data to spot real trends without getting bogged down in weekly noise. If you’re running heavy PPC campaigns, a quick weekly update on spend and conversions can prevent budget fires. Just don’t over-report; nobody wants a daily email that says everything is still fine.
What is the difference between a marketing dashboard and a marketing report?
A dashboard is a live look at your data while a report is a story about that data. Dashboards are great for internal teams who need to see real-time shifts in traffic or spend. Reports are curated documents that explain what the numbers actually mean for the business. Use a dashboard to monitor your pulse, but use a report to plan your next big move.
How do I show ROI in a marketing report for brand awareness campaigns?
Show ROI for brand awareness by tracking assisted conversions and branded search volume. You won’t always see a direct line from a video view to a sale, but you can see if more people are searching for your name. Check your “share of voice” against competitors to prove you’re winning the room. Awareness is about filling the funnel for future revenue, not just immediate clicks.
What are the best tools for creating a marketing performance report in 2026?
In 2026, Google Analytics 4 is your foundation, especially with the new attribution models. For pulling it all together, tools like Supermetrics are popular, with plans starting at €29 per month for basic users. Databox is another heavy hitter, though their professional plans now start at $159 per month. Pick a tool that makes your marketing performance report template easy to read, not just complicated to build.
How can I automate my marketing reporting without losing the personal touch?
Automate the boring stuff like data collection, but never automate the insights. Use integrations to pull your numbers into one place so you aren’t copy-pasting for hours. Then, spend that saved time writing human summaries that explain the “why” behind the numbers. Automation should buy you more time for strategy, not replace your brain. That’s how you keep the personal touch alive and well.
Should I include negative results in my marketing report?
Absolutely include the bad news. Hiding a failed campaign is the fastest way to lose a client’s trust. When you own a loss, you prove that you’re actually watching the data and aren’t just a yes man. Explain what went wrong, what you learned, and how you’re pivoting. It turns a mistake into a strategic win for the future and keeps everyone on the same page.