

Keep reading
Rather we just did it for you?
Let's get your business seen.
Social media, websites, SEO and ads from a team you can actually meet.
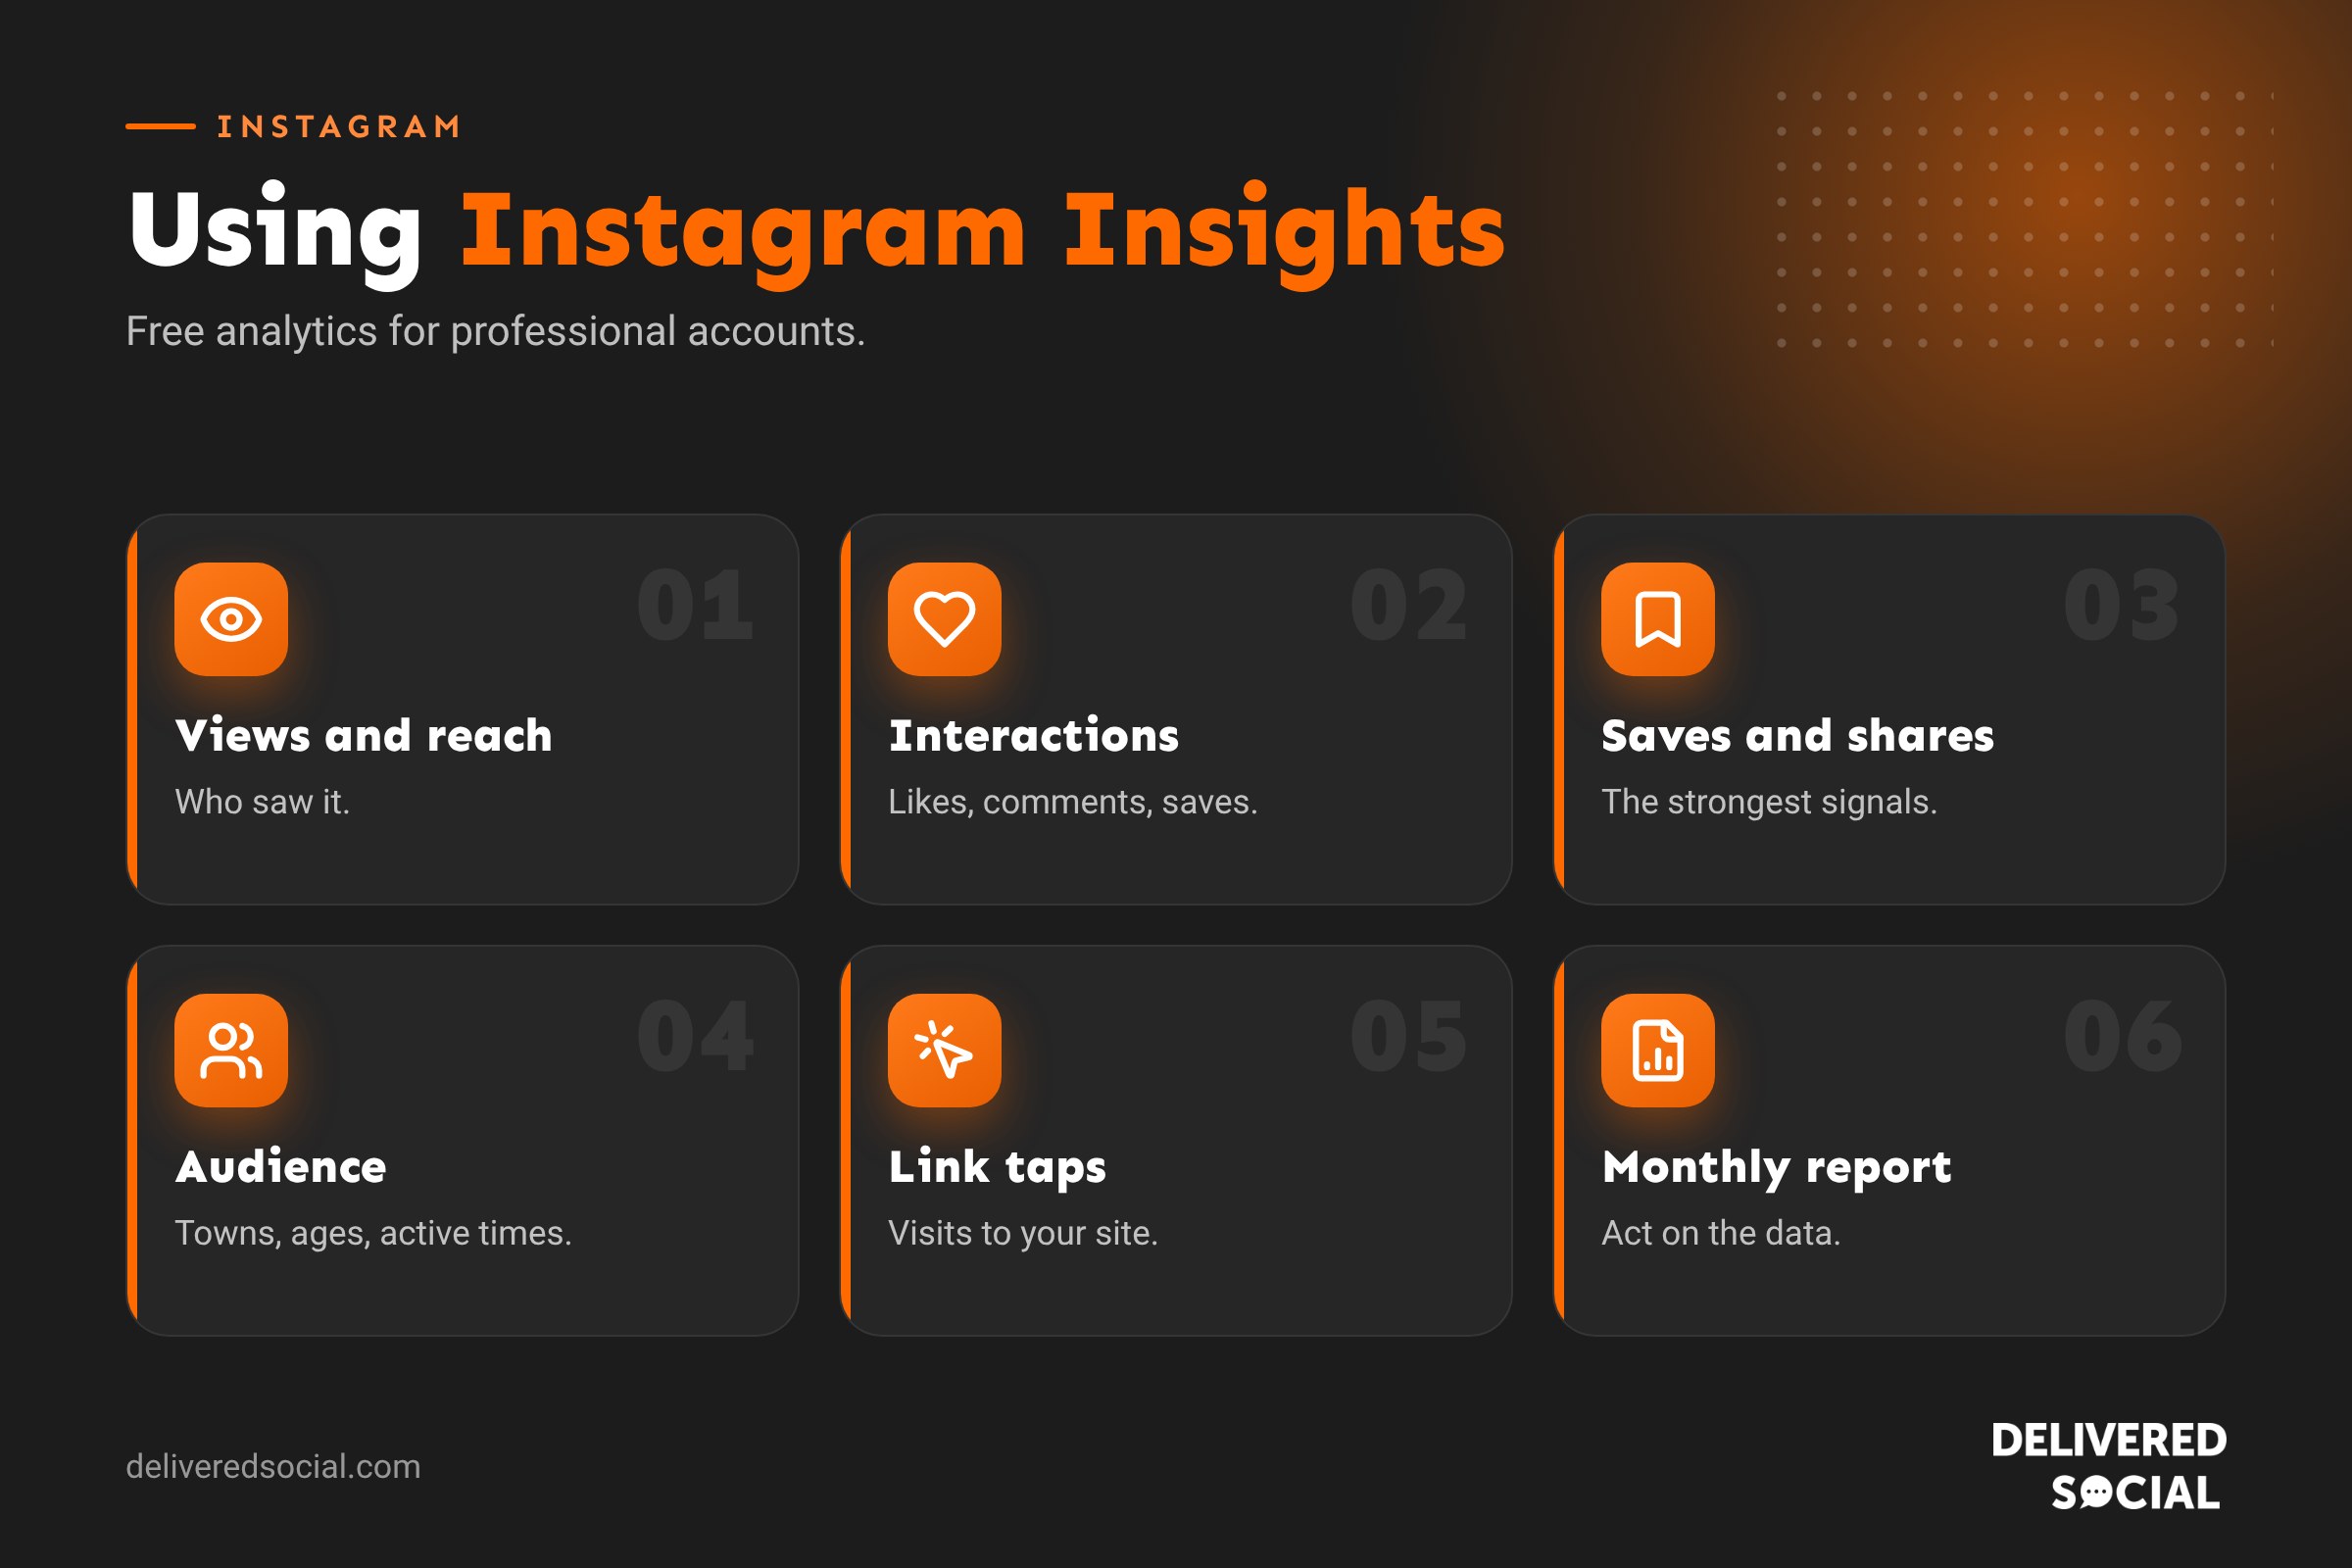
Posting on Instagram without checking your analytics is like running a shop without looking at the till. Instagram Insights, the app’s built-in analytics tool, shows who your followers are, which posts work, when people are online and how many become customers. This guide explains how to access Instagram analytics, what each metric means, which numbers matter most for businesses, and how to turn the data into better content.
What is Instagram Insights?
Instagram Insights is the free analytics dashboard built into Instagram for professional accounts. It shows data on your reach, engagement, followers and content, for the account as a whole and for each post, Reel and Story. If you don’t see Insights, switch to a professional account (business or creator) in Settings. It’s free.
How to access Instagram Insights
On the app
- Go to your profile.
- Tap the Professional dashboard or Insights button.
- Choose a date range, such as the last 30 days.
For a single post
- Open the post or Reel.
- Tap View insights underneath.
On a computer
Open Meta Business Suite and go to Insights. You’ll see Instagram and Facebook data together, with longer date ranges and exportable reports.
The main sections of Instagram Insights
| Section | What it shows |
|---|---|
| Views | How many times your content was seen, and by followers vs non-followers |
| Interactions | Likes, comments, saves, shares and replies |
| Followers | Growth, location, age, gender and most active times |
| Content you shared | Performance of each post, Reel and Story |
| Profile activity | Profile visits and taps on links, call or email buttons |
Instagram changes the names and layout of metrics from time to time. In recent years it has moved towards “views” as a main measure across formats.
Key Instagram metrics explained
- Views: the number of times your content was displayed.
- Reach (accounts reached): the number of unique accounts that saw your content.
- Interactions: all actions on your content, such as likes, comments, saves and shares.
- Saves: people bookmarking your post. A strong sign it’s useful.
- Shares: people sending your post to others. A sign it’s worth talking about.
- Profile visits: how many people viewed your profile.
- External link taps: clicks on the link in your bio.
- Follows: new followers from a specific post.
- Average watch time and skip rate for Reels: how long people watch and how many scroll away early.
Which Instagram metrics matter most for businesses?
| Goal | Watch these numbers |
|---|---|
| Reach new people | Views from non-followers, reach, shares |
| Build trust | Saves, comments, follower growth |
| Get enquiries | Profile visits, link taps, messages, call and email taps |
| Sell products | Link taps, shop views and website sales from Instagram |
Likes are nice, but saves, shares and link taps usually tell you more about whether content is working for your business.
Understanding your audience
Under Total followers, Insights shows:
- Top towns and countries, useful for checking you’re reaching local customers.
- Age range and gender.
- Most active times by day and hour.
If you’re a Guildford café but most followers are overseas, your content or hashtags may be attracting the wrong audience.
How to use Instagram Insights to improve your content
- Find your top five posts from the last 90 days by reach, saves or shares.
- Look for patterns: format (Reel, carousel, photo), topic, hook, length and time posted.
- Make more of what works, adapting the winning formats to new topics.
- Check Reels retention. If people skip in the first three seconds, improve your hooks.
- Schedule posts for your followers’ most active times.
- Track monthly and compare like with like.
Measuring Instagram engagement rate
A simple engagement rate is interactions divided by reach, multiplied by 100. For example, a post that reached 2,000 people and got 100 likes, comments, saves and shares has a 5% engagement rate. Tracking this monthly shows whether your content is becoming more engaging. Our guide to engagement rate explains other ways to calculate it.
Instagram analytics tools beyond Insights
- Meta Business Suite: longer date ranges, Facebook and Instagram together, exportable data.
- Google Analytics: shows what Instagram visitors do on your website, including enquiries and sales.
- Third-party tools such as Metricool: competitor comparisons, scheduled reports and analytics across platforms.
- UTM tracking links: tag the link in your bio so you can see Instagram traffic clearly in Google Analytics.
A simple monthly Instagram report
- Followers at the start and end of the month.
- Total reach and views.
- Average engagement rate.
- Top three posts and why they worked.
- Profile visits and link taps.
- Enquiries or sales from Instagram.
- Three actions for next month.
Ten minutes a month with these numbers keeps your Instagram strategy on track.
Common mistakes with Instagram analytics
- Focusing only on likes and followers instead of enquiries.
- Comparing different date ranges or formats unfairly.
- Judging posts too early. Reels can keep growing for days.
- Ignoring Story insights, where exits and replies show what people like.
- Never checking website analytics to see if Instagram brings customers.
Reading Reels insights
Reels have their own detailed metrics, and they’re worth checking closely because Reels are often how businesses reach new people:
- Views and accounts reached: how far the Reel travelled.
- Skip rate: the share of people who scrolled past in the first few seconds. A high skip rate means your opening needs work.
- Average watch time: how long people watched on average.
- Retention graph: where people dropped off. Look for the moment the line falls sharply and fix what happens there.
- Shares and saves: the strongest signals that a Reel is valuable.
- Follows: how many people followed after watching.
Compare your Reels with each other rather than with big creators. If a Reel performs well above your average, study it and make more like it.
Reading Stories insights
Story insights show reach, replies, sticker taps and navigation: forward taps, back taps, next story and exits. Lots of back taps suggest people wanted another look, which is a good sign. Lots of exits on a particular frame suggest that frame lost attention. Use polls and questions to learn what your audience wants, and check which Stories lead to profile visits and link taps.
Turning insights into decisions
Data is only useful if it changes what you do. After your monthly review, pick three specific actions, such as “Post two more carousels a week because they get the most saves”, “Move posts to 7pm when followers are most active” or “Test a stronger first line on Reels to reduce skips”. Then check next month whether those changes worked.
Quick glossary
- Professional dashboard: the hub for Insights and business tools.
- Reach: unique accounts that saw your content.
- Views: total times your content was seen.
- Interactions: all likes, comments, saves and shares.
- UTM: tags added to links to track traffic sources.
Benchmarks: what is a good result?
Comparing yourself with huge brands or influencers isn’t helpful. The most useful benchmark is your own average. Work out your typical reach, saves and link taps per post over the last three months, then judge each new post against that. A post that doubles your average is a winner worth copying, whatever the raw numbers. As your account grows, your averages will rise too, so revisit them every quarter.
Insights for creators vs businesses
Creator accounts and business accounts see broadly the same Insights, but business accounts also get contact buttons such as call, email and directions, whose taps appear in profile activity. If enquiries matter more to you than growing an audience, a business account usually gives you the more useful data. You can switch between account types in Settings at any time.
Key takeaways
- Instagram Insights is free for business and creator accounts.
- Saves, shares and link taps matter more than likes for businesses.
- Use audience data to check you’re reaching the right people.
- Find patterns in your top posts and make more of them.
- Combine Insights with website analytics to measure real results.
Instagram updates Insights regularly, renaming metrics and adding new ones. If a number we mention looks different in your app, the meaning is usually the same under a new name. Focus on the principles: who saw your content, how they reacted and what they did next.
If you manage Instagram for a team, share a short monthly summary with everyone involved so they can see what content is working and why.
Frequently asked questions
How do I see Instagram analytics?
Switch to a professional account, then tap Professional dashboard or Insights on your profile.
Is Instagram Insights free?
Yes, for business and creator accounts.
Can I see who viewed my Instagram profile?
No. Insights shows how many people visited, not who they are.
How far back does Instagram Insights go?
The app shows recent periods, typically up to 90 days, with longer ranges in Meta Business Suite.
What is a good engagement rate on Instagram?
It varies by industry and account size; track your own rate monthly and aim to improve it.
Want Instagram that you can measure?
We manage Instagram and report on real results for businesses across Surrey, Hampshire and the UK. See our social media management services or call us on 01483 608 303.