

Keep reading
Rather we just did it for you?
Let's get your business seen.
Social media, websites, SEO and ads from a team you can actually meet.
There is no single set of social media benchmarks UK businesses can rely on, and that is the most useful thing to know first. Published reports put average Instagram engagement anywhere from about 0.3% to over 5%, depending on who measured it and how. A good engagement rate for your account is one that beats your own recent past and the accounts you compete with, not a headline figure.
This article sets out what the main 2026 reports actually say, with dates and sample sizes. We do not invent figures or average other people’s numbers together. We show you where each figure comes from, how engagement rate is calculated, why benchmarks mislead, and a practical way to benchmark yourself instead.
Social media benchmarks UK businesses see quoted: what the reports say
We opened three published sources while writing this guide. Here is what each one says, in its own terms.
Quid (formerly Rival IQ), 2026 industry benchmark report
Published on 5 March 2026, this report randomly selected 150 companies in each of 18 industries from a database of more than 200,000 companies. It includes organic and paid posts from national and international brands. It calculates engagement rate as total interactions divided by follower count. The median engagement rates it reports are:
- TikTok: 2.01%
- Instagram: 0.30% (down from 0.36% in the previous year)
- YouTube: 0.21%
- X: 0.03%
The page does not state an exact data collection window, and the text we could read did not give a Facebook figure.
Socialinsider, social media benchmarks
Socialinsider’s benchmark page analyses organic posts from brand accounts with 1,000 to 1 million followers. It says it analysed millions of posts per platform. Its engagement rate is per-post interactions divided by the profile’s follower count, averaged across posts, but the interactions it counts differ by platform: likes and comments for Instagram, and likes, comments, shares and saves for TikTok. Its 2025 figures are:
- TikTok: 3.7%
- Instagram: 0.48%
- Facebook: 0.15%
- X: 0.12%
A note on reliability: the page labels some periods inconsistently, so we have used only the figures it presents as 2025 values.
Dash Social, UK social media benchmarks
This one is UK-specific. Dash Social’s UK report looked at nearly 175 UK Instagram and TikTok accounts with at least 1,000 followers, across sectors including beauty, fashion, media, food and drink, retail, home, baby and children, and wellness. The data covers 1 July to 31 December 2025, and the page was updated in March 2026. It reports average engagement rates of 1.6% for Instagram and 4.5% for TikTok. The page does not say how it calculates engagement rate, and it does not split results by sector.
What happens when you put them side by side
Instagram comes out at 0.30%, 0.48% and 1.6% in three reputable reports. These numbers are not wrong. They simply measure different things, in different samples, over different periods. Quid uses a median, Socialinsider an average (and counts different interactions), and Dash Social an average for UK brands across a limited set of sectors. The gap between 0.30% and 1.6% is more than fivefold.
The same pattern shows in a roundup by ClickMinded, updated in July 2026. It compiles figures from other publishers and warns that they use different samples and formulas, with Instagram numbers ranging from about 0.45% to about 5.4%. It says plainly that it does not own proprietary data and that the figures should not be ranked against each other.
How to calculate engagement rate (and which method to use)
This is where most benchmark confusion starts. There are three common ways to calculate engagement rate, and the answer changes with each.
- By followers. (Total interactions on a post ÷ followers) × 100. This is the most common method and the one the big reports above mostly use. It is easy to calculate, but it penalises large accounts and accounts with a lot of inactive followers.
- By reach. (Total interactions ÷ people who saw the post) × 100. This tells you how engaging a post was to the people who actually saw it. It is usually higher than the follower-based rate, and it is a better measure of content quality.
- By impressions or views. (Total interactions ÷ times the post was shown) × 100. Common on TikTok and for video, where views matter more than followers.
Which interactions you count matters too. Some reports count only likes and comments. Others add shares, saves, reposts or even link clicks. A rate that includes saves and shares will be higher than one that does not.
Here is a worked example. A post has 40 likes, 6 comments, 4 saves and 2 shares: 52 interactions. You have 5,000 followers and the post reached 1,800 people.
- By followers: 52 ÷ 5,000 × 100 = 1.04%
- By reach: 52 ÷ 1,800 × 100 = 2.89%
Same post, two very different numbers. Neither is “wrong”. The mistake is comparing your reach-based figure to a benchmark that uses followers, or the other way round.
Our recommendation for small business accounts: track the rate by followers (so you can compare with published reports) and the rate by reach (so you can judge your content). Record which method you use in your tracker, and never change it mid-year without noting it. Social media benchmarks UK businesses quote online often come from global samples, so treat them as a rough guide.
Why benchmarks mislead
Used well, benchmarks give you a rough map. Used badly, they send you to the wrong place. Watch out for these traps.
The sample is not your business
Most of the reports above look at brand accounts with 1,000 to 1 million followers, across all industries. A village butcher with 800 followers, a B2B software firm and a global fashion label are not in the same game. An average that blends them tells you very little about any of them.
Account size changes the rate
Engagement rates can differ a lot between small and large accounts, so a rate that looks poor for one may be normal for the other. Check whether a report breaks its results down by follower size, and compare like with like.
Paid and organic get mixed together
Some reports include paid posts, others are organic only. The Quid report includes both. Paid promotion can lift likes and comments, so a blended figure is not a clean measure of organic performance.
The period is different
Engagement shifts with the season, the platform’s algorithm and the mix of formats. A figure for July to December 2025 is not a figure for spring 2026. Always note the date range.
“Average” and “median” are not the same
A few viral accounts can drag an average up. A median is less affected, which is why it often looks lower. Check which one a report uses before comparing.
Reports are written by tool companies
Benchmark reports are produced by software firms, and their samples come from their own databases or the accounts they can access. That does not make them dishonest, but it does mean the data reflects what they can see, and some do not publish every detail of their method (the Dash Social UK page, for example, does not say how it calculates engagement). Treat them as indicators, not facts about the whole market.
What is a good engagement rate, then?
Given all that, how do you decide what counts as a good engagement rate for your own account? Use three yardsticks, in this order:
- Your own history. The most reliable benchmark is how you performed over the last three to six months. Beating your own median is real progress.
- Your direct competitors. Pick five to ten accounts of similar size, location and sector. Their results are far more relevant than a global average.
- Published benchmarks. Use these as a sense check only, and choose one that matches your platform, your account size and your calculation method.
If your Instagram engagement by followers is around the 0.3% to 0.5% region, you are in the territory several large studies describe as typical. If it is well above, such as 1.5% or higher, you are likely doing better than most brand accounts, though the UK sample from Dash Social shows that higher numbers are possible for certain sectors. If it is far below, check your audience quality first. Our guide to spotting fake followers shows how. Use social media benchmarks UK marketers publish as a starting point, then compare yourself with your own last quarter.
How to benchmark yourself in five steps
- Choose one method and stick to it. For example, interactions (likes, comments, saves, shares) divided by followers on the day of posting.
- Collect 90 days of posts. Record the format, topic, date, reach and interactions for each in a simple spreadsheet.
- Find your median. Sort the engagement rates and take the middle value. Do this overall and by format (Reels, carousels, images, Stories).
- Add a competitor set. Collect the same public data (likes and comments only, since that is all you can see) for five to ten similar accounts over the same period.
- Set a target against yourself. For example, lift your median saves per post by 20% over the next quarter. Small, specific targets are easier to act on than “reach the industry average”.
Revisit every quarter. If your numbers fall, our 7-point check for an Instagram engagement drop helps you work out why. To keep your benchmarking tied to your calendar, a good content calendar template can record what you posted alongside the results.
An example of reading the numbers sensibly
Imagine a Surrey physiotherapy clinic with 2,400 Instagram followers. Over 90 days its median post earns 14 interactions, so its median engagement rate by followers is about 0.58%. That is above the Quid median of 0.30% and the Socialinsider average of 0.48%, but well below Dash Social’s UK figure of 1.6%.
Which one matters? None of them, on their own. The clinic compares itself with six similar local clinics and finds their median is around 0.4%. That is a fair result, so the clinic sets an aim of lifting saves on its exercise videos, because those drive bookings. The published figures were a sense check. The competitor set and the clinic’s own trend did the real work. (This is an illustrative example, not a real client.)
Which metrics matter more than engagement rate?
Engagement rate is useful, but it is not the goal. For most small businesses, these matter more:
- Saves and shares. They show people found the content valuable enough to keep or pass on.
- Reach among non-followers. This tells you whether new people are finding you.
- Profile visits and link clicks. These show people are interested enough to find out more.
- Enquiries and sales. Ask new customers how they found you, and track DMs, calls and form submissions that come from social.
An account with a modest engagement rate that drives a steady flow of enquiries is doing better than an account with a high rate that does nothing for the business. The most useful social media benchmarks UK teams can have are the ones taken from their own accounts.
Common questions about social media benchmarks
Are there official UK benchmarks for social media engagement?
No. There is no official body publishing them. All the figures come from private companies, which is why you should check the method behind any number you quote.
How often do benchmarks change?
Most reports are updated yearly, some quarterly. Platform changes and shifts in how people use social media can move the numbers, so check the date before you use one.
Should I report benchmarks to clients or my boss?
Yes, but with context. Say which report, which year and which method. Pair it with your own history and a competitor comparison so the story is fair.
Is a low engagement rate always bad?
No. A low rate on a large, broad audience can still produce plenty of sales. What matters is whether the trend is improving and whether the activity supports business goals.
Get the free Benchmark reference sheet
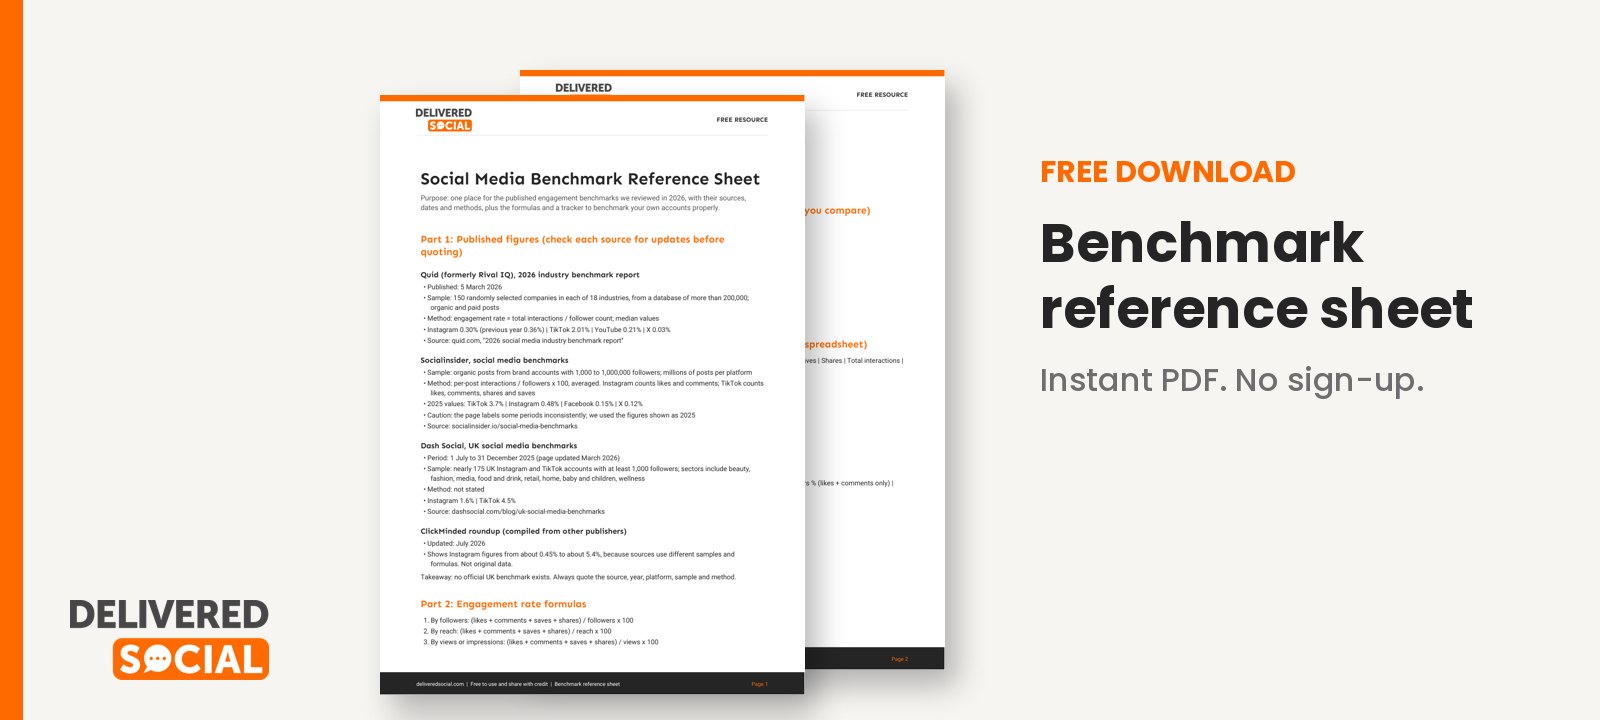
We have created a Benchmark reference sheet that lists the sources and figures above with their dates and methods, the engagement rate formulas, and a template for tracking your own median and competitor set. It is a good document to share with colleagues or clients who ask “what is a good number?”.
Download the free Benchmark reference sheet
If you would like help with reporting that makes sense for your business, Delivered Social offers social media management with clear, honest reporting, and you are welcome to get in touch.