

Keep reading
Rather we just did it for you?
Let's get your business seen.
Social media, websites, SEO and ads from a team you can actually meet.
Engagement rate is one of the most useful numbers in social media. It tells you whether people actually care about your content, not just whether they saw it. A small account with high engagement often wins more customers than a big account nobody interacts with. This guide explains what engagement rate is, how to calculate it, what a good engagement rate looks like on each platform, and practical ways to keep your audience engaged.
What is engagement rate?
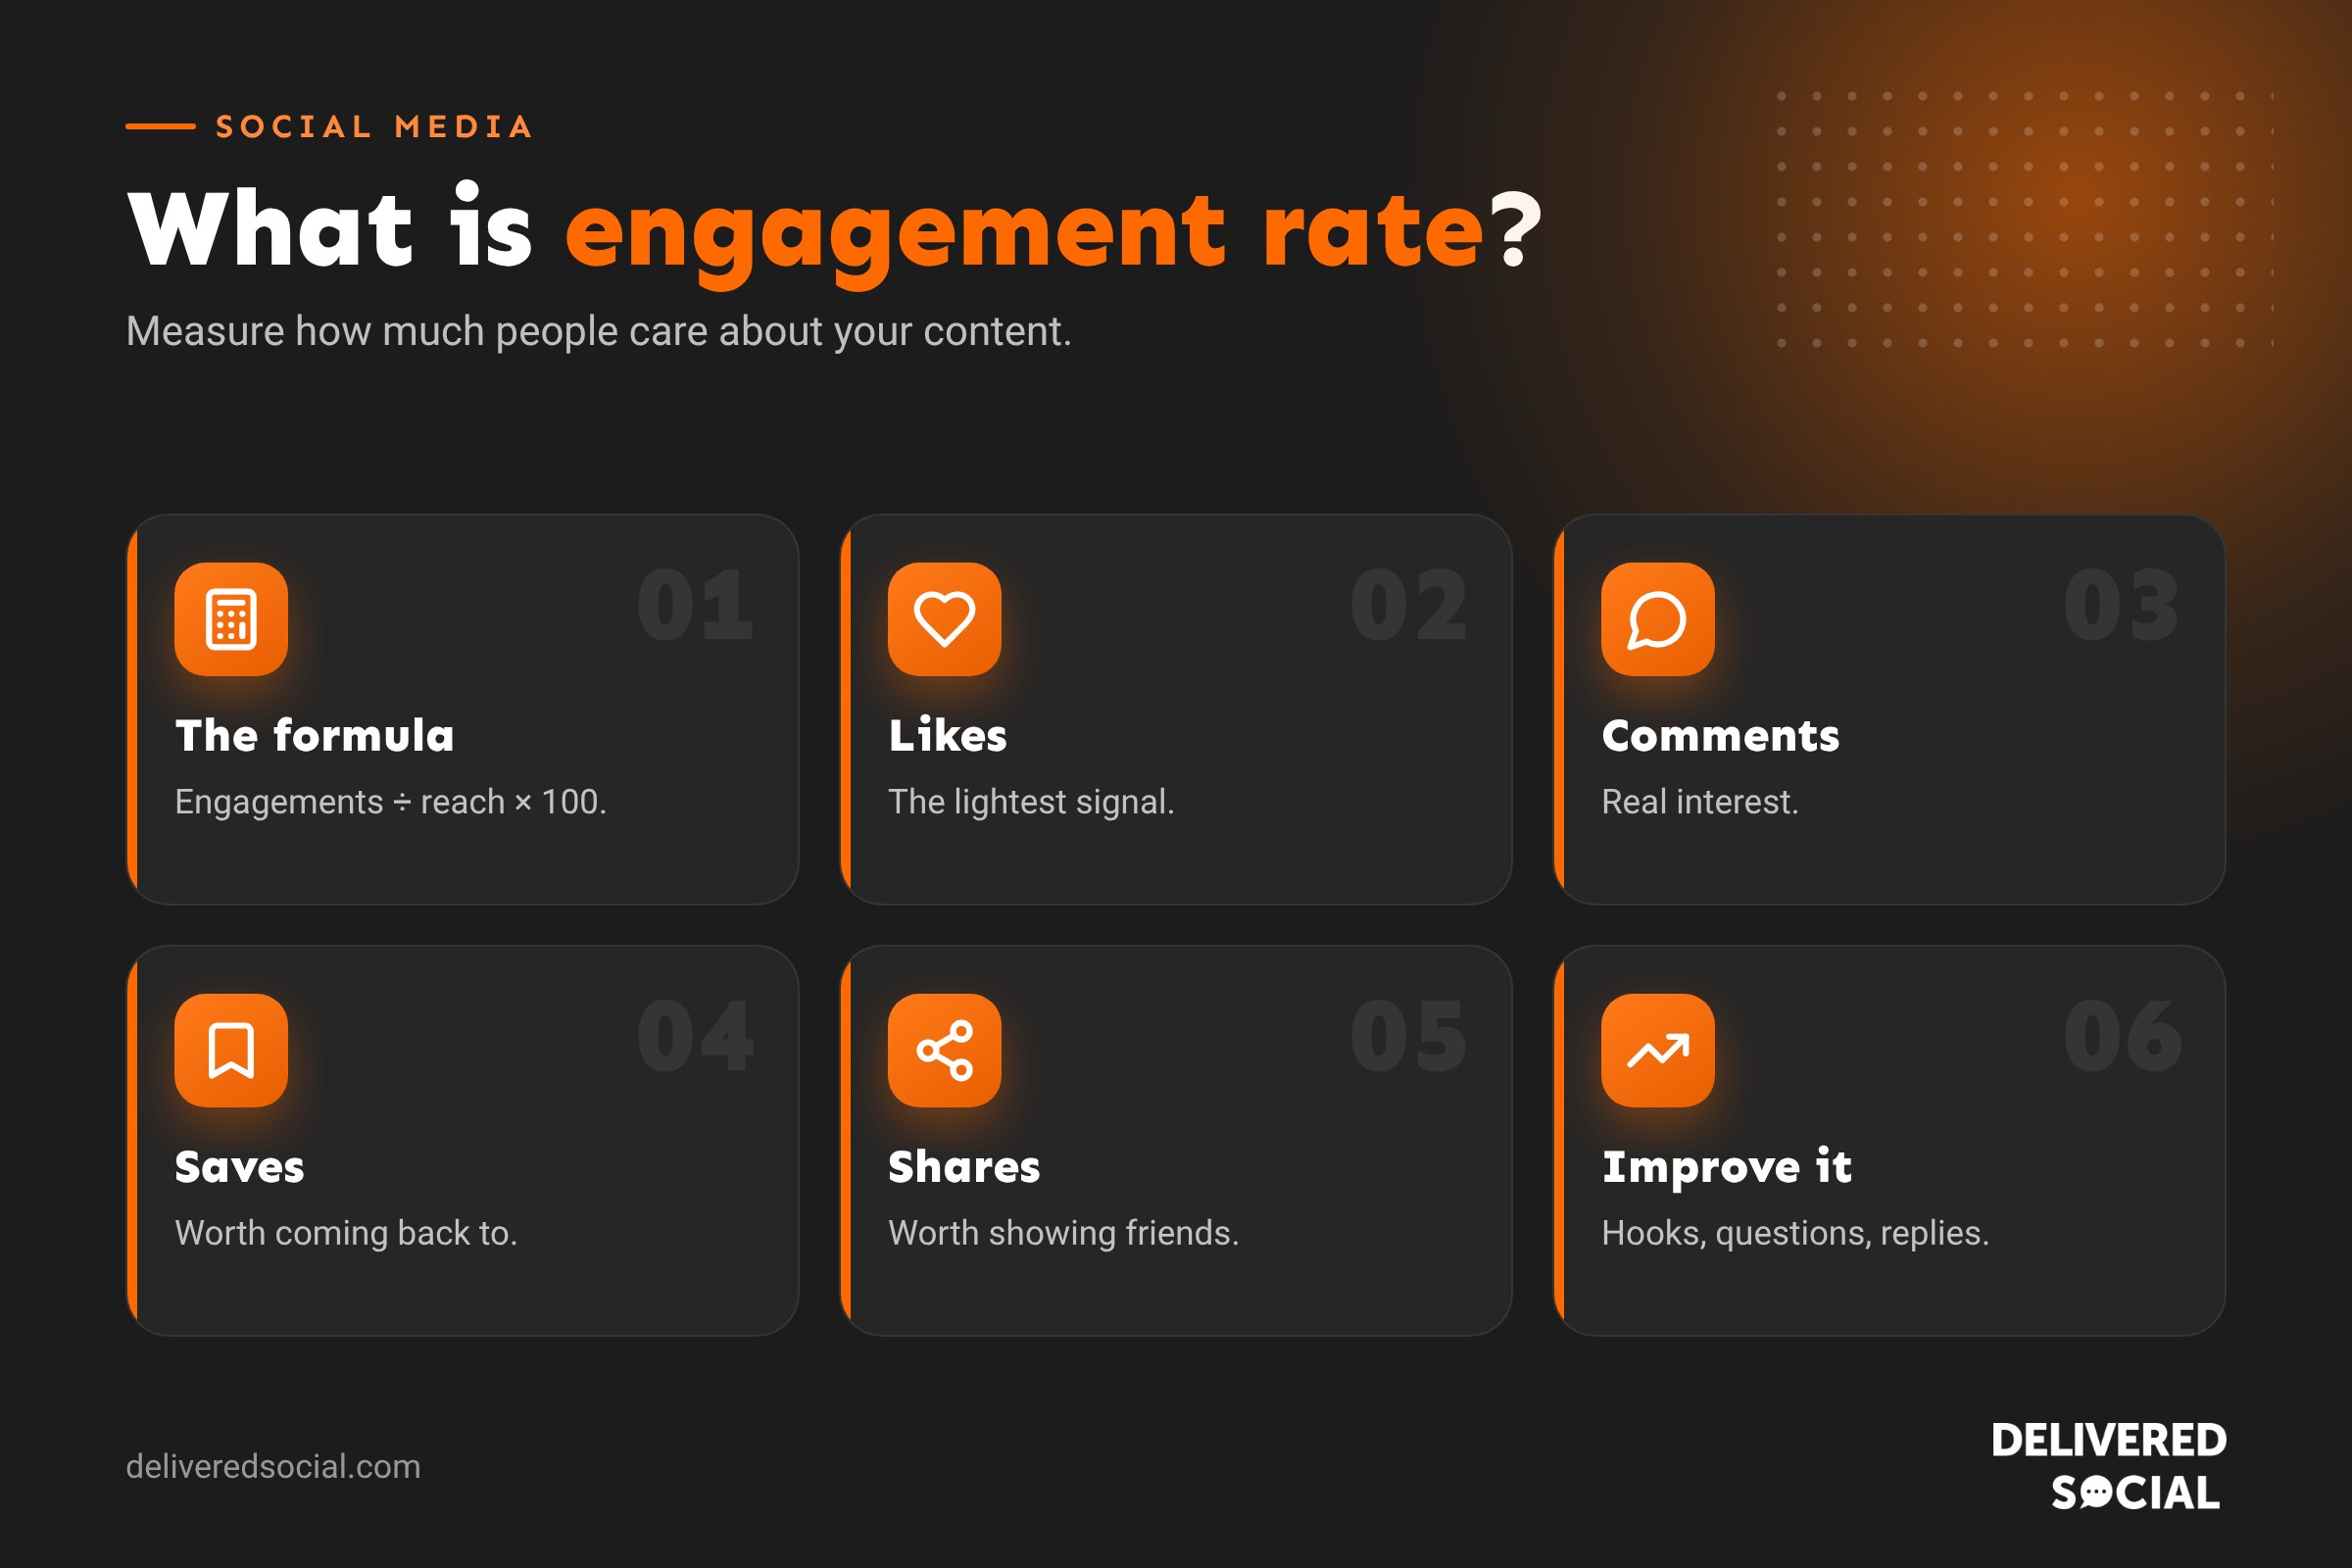
Engagement rate measures how much people interact with your content compared with how many people could have seen it. Interactions, or “engagements”, usually include:
- Likes and reactions.
- Comments.
- Shares and reposts.
- Saves.
- Clicks (on some platforms).
- Replies to Stories and sticker taps.
It’s expressed as a percentage, so you can compare posts, campaigns and even accounts of different sizes fairly.
How to calculate engagement rate
There are a few common formulas. The one you choose depends on what you want to know.
| Formula | Calculation | Best for |
|---|---|---|
| Engagement rate by followers | Engagements ÷ followers × 100 | Comparing accounts |
| Engagement rate by reach | Engagements ÷ reach × 100 | Judging how engaging a post was to people who saw it |
| Engagement rate by impressions | Engagements ÷ impressions × 100 | Paid content and frequent viewers |
| Engagement rate by views (video) | Engagements ÷ views × 100 | TikTok, Reels and YouTube |
Example
Your Instagram post reached 2,000 people and got 80 likes, 12 comments, 6 shares and 22 saves. That’s 120 engagements.
Engagement rate by reach = 120 ÷ 2,000 × 100 = 6%.
If you have 5,000 followers, engagement rate by followers = 120 ÷ 5,000 × 100 = 2.4%.
Engagement rate by reach is usually the most useful for small businesses, because it shows how people responded once they actually saw your content.
What is a good engagement rate?
“Good” depends on the platform, your industry and your account size. Smaller accounts usually have higher engagement rates than large ones. As a rough guide, recent industry benchmarks put average engagement rates at roughly:
| Platform | Typical average | Strong performance |
|---|---|---|
| TikTok | Around 3% to 4% | 5% or more |
| Around 0.5% to 1% by followers | 2% or more | |
| Around 0.1% to 0.2% by followers | 0.5% or more | |
| Around 1% to 3% by impressions | 4% or more |
Benchmarks vary between studies, so compare yourself mainly against your own past performance and similar local businesses.
Why engagement rate matters
- Algorithms reward it. Posts that get early likes, comments, shares and saves are shown to more people.
- It shows real interest. Followers can be bought or inactive; engagement is harder to fake.
- It leads to sales. Engaged followers are more likely to visit your website, message you and buy.
- It tells you what works. Comparing engagement across posts shows which topics and formats your audience loves.
Not all engagement is equal
Some actions mean more than others. A like takes a split second. A comment, share or save shows much stronger interest.
| Engagement | What it signals |
|---|---|
| Like | Mild approval |
| Comment | Interest enough to respond |
| Save | Useful, worth coming back to |
| Share | Worth showing friends |
| Click or DM | Strong buying interest |
Platforms increasingly value shares, saves and meaningful comments over likes, so aim for content that earns these.
How to improve your engagement rate
1. Know your audience
Look at which posts got the most engagement in the past three months. What do they have in common? Make more of that.
2. Hook people immediately
The first line of a caption and the first second of a video decide whether people stop. Lead with a question, a bold statement or a result.
3. Post content worth saving
Tips, checklists, how-tos and guides earn saves. Carousels are particularly good for this.
4. Ask questions
End posts with a simple question: “Which would you choose?” or “What’s your go-to order?” Easy questions get more replies.
5. Use interactive features
Polls, quizzes and question stickers in Stories, and comment polls on TikTok, make engagement effortless.
6. Reply to every comment
Replying quickly, especially in the first hour, encourages conversation and signals to the platform that your post is sparking interest.
7. Show real people
Faces, behind-the-scenes moments and team stories almost always outperform polished product shots.
8. Post when your audience is online
Check your insights for when followers are most active, and post just before those times.
9. Collaborate
Collab posts with local businesses, customers and partners bring in new, engaged audiences.
10. Be consistent
Regular posting keeps you in people’s feeds and builds habits.
Engagement rate killers
- Buying followers, who never engage and drag your rate down.
- Posting only adverts and sales messages.
- Ignoring comments and messages.
- Long gaps between posts.
- Low-quality images or hard-to-read graphics.
- Engagement bait such as “like if you agree”, which platforms may reduce in reach.
How to track engagement rate
- Native insights: Instagram, Facebook, TikTok and LinkedIn all show engagement data for business accounts.
- Social media tools: tools such as Metricool calculate engagement rates for you across platforms.
- A simple spreadsheet: record reach and engagements for each post monthly and calculate the rate yourself.
Review monthly and look for trends rather than reacting to individual posts. Our guide to social media KPIs explains which other numbers to track.
Engagement rate and your business goals
Engagement is a means to an end. High engagement is great, but your real goals are enquiries, bookings and sales. Track how engagement connects to website visits, messages and leads. If a type of post gets lots of likes but never leads to enquiries, balance it with content that moves people closer to buying.
Engagement rate by type of content
Different formats tend to drive different kinds of engagement. Knowing this helps you plan a balanced mix:
| Content type | Typical strength |
|---|---|
| Carousels | Saves and shares, especially tips and guides |
| Reels and short videos | Reach and shares |
| Stories with stickers | Replies, poll votes and quiz answers |
| Behind-the-scenes photos | Likes and comments from loyal followers |
| Questions and polls | Comments |
| Customer stories | Shares and trust |
Engagement rate for different industries
Some industries naturally get higher engagement than others. Food, travel, beauty, pets and community organisations often see strong engagement because their content is visual and emotional. Professional services, finance and B2B businesses may see lower average rates on Instagram but stronger engagement on LinkedIn. Compare yourself with businesses like yours rather than with influencers or global brands.
A simple monthly engagement review
- List last month’s posts with their reach and total engagements.
- Calculate the engagement rate for each.
- Highlight the top three and bottom three.
- Note what the top posts have in common: topic, format, time or style.
- Plan more of what worked next month, and drop or rethink what didn’t.
Engagement on paid vs organic posts
Paid posts usually have a lower engagement rate than organic posts, because ads reach people who don’t know you yet. That’s normal. When judging ads, focus on the cost per result, such as cost per click, enquiry or sale, rather than engagement rate alone. For organic posts, engagement rate is a great indicator of how well your content resonates with your existing audience and how likely the platform is to show it to more people.
Community management and engagement
Engagement isn’t just about what you post; it’s about how you respond. Businesses that reply to every comment, answer messages quickly, thank people for tags and join conversations in their community usually see engagement rise over time. People are more likely to comment when they know a real person will reply. Set aside ten to fifteen minutes a day for community management, and you’ll often see the results in your engagement rate within a few weeks.
Key takeaways
- Engagement rate shows how much people interact with your content compared with how many could see it.
- Engagement rate by reach is usually the most useful measure for small businesses.
- Saves, shares and comments are worth more than likes.
- Compare yourself mainly with your own past results and similar businesses.
- Reply to comments, ask questions and post consistently to boost engagement.
Quick glossary
- Reach: the number of people who saw your post.
- Impressions: the number of times your post was shown, including repeat views.
- Engagements: likes, comments, shares, saves and clicks.
Remember that engagement rate is one number among several. Use it alongside reach, website clicks and enquiries to get the full picture of how your social media is performing for your business.
Frequently asked questions
What is a good engagement rate on Instagram?
Around 1% to 2% by followers is solid for most businesses; smaller accounts often see more.
How do you calculate engagement rate?
Divide total engagements by reach (or followers) and multiply by 100.
Why is my engagement rate dropping?
Common causes include posting less often, content your audience doesn’t find useful, inactive or fake followers, and algorithm changes.
Do saves and shares count as engagement?
Yes, and they’re among the most valuable types.
Want a more engaged audience?
We create content that gets people talking, saving and sharing for businesses across Surrey, Hampshire and the UK. See our social media management services or call us on 01483 608 303.